Yo, what’s up, folks! I’m here as a supplier of analyzing instruments, and today we’re gonna dive into the world of signal – processing methods used in these bad boys. Analyzing Instruments
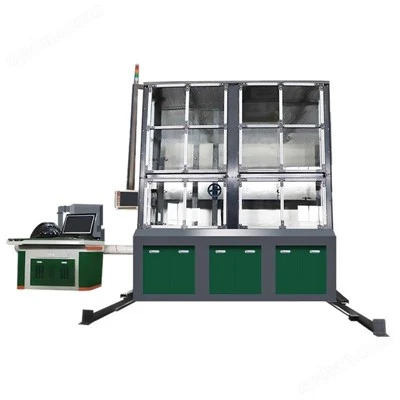
First off, let’s talk about why signal – processing is such a big deal in analyzing instruments. You see, these instruments are designed to measure all kinds of stuff, like chemical compounds, electrical signals, or physical properties. But the signals they pick up are often noisy, messy, and hard to make sense of right away. That’s where signal – processing steps in to clean things up and extract the useful information.
One of the most basic signal – processing methods is filtering. Think of it like a sieve. You’ve got a big mix of different frequencies in your signal, and you only want to keep the ones that matter. Low – pass filters, for example, let through the low – frequency components and block the high – frequency noise. This is super useful when you’re dealing with slowly changing signals. Say you’re using an instrument to monitor the temperature in a room over time. The temperature changes relatively slowly, so any high – frequency noise (like electrical interference) can be removed with a low – pass filter to get a cleaner temperature reading.
High – pass filters do the opposite. They let the high – frequency components pass through while blocking the low – frequency ones. This can be handy when you’re trying to detect sudden changes or fast – occurring events. For instance, in an electrocardiogram (ECG) machine, a high – pass filter can be used to remove the baseline drift caused by a patient’s breathing (a low – frequency signal) and focus on the high – frequency electrical signals corresponding to the heartbeats.
There’s also the band – pass filter, which is like a Goldilocks of filters. It only allows a specific range of frequencies to pass through. This is great when you’re interested in a particular frequency band. For example, in audio analyzers, if you’re only interested in the frequencies that make up human speech (usually between 300 Hz and 3400 Hz), a band – pass filter can isolate this range and remove all the other frequencies that aren’t relevant.
Another important signal – processing method is Fourier transform. It’s like a magic wand that can break a complex signal down into its individual frequency components. You know how a musical chord is made up of different notes played together? The Fourier transform is like taking that chord apart and showing you which notes are in it and how loud each one is. In analyzing instruments, this is incredibly useful. For example, in a spectrometer, which measures the intensity of light at different wavelengths (which are related to frequencies), the Fourier transform can help identify the specific chemical compounds present in a sample based on the unique frequency patterns they produce.
There’s also the inverse Fourier transform, which is like putting the "notes" back together to recreate the original signal. This can be used to reconstruct a signal after it’s been processed in the frequency domain. For example, if you’ve filtered out some unwanted frequencies using Fourier transform, you can use the inverse Fourier transform to get back a clean version of the original – looking signal.
Wavelet transform is another cool signal – processing technique. It’s kind of like an upgraded version of the Fourier transform. While the Fourier transform looks at the entire signal at once to find its frequency components, the wavelet transform can look at different parts of the signal at different scales. This makes it really good at detecting sudden changes or local features in a signal. In a seismic analyzer, for example, wavelet transform can be used to detect small earthquakes or seismic events that might be hidden in the background noise. It can zoom in on the parts of the signal where these events are likely to occur and analyze them more closely.
Now, let’s talk about sampling and quantization. Sampling is like taking snapshots of a continuous signal at regular intervals. You can’t measure a signal all the time, so you take samples at specific points. The rate at which you take these samples is called the sampling rate. According to the Nyquist – Shannon sampling theorem, you need to sample a signal at a rate that’s at least twice the highest frequency component of the signal to be able to accurately reconstruct it later. For example, if your signal has a highest frequency of 1000 Hz, you need to sample it at a rate of at least 2000 samples per second.
Quantization is the process of converting the continuous values of the sampled signal into discrete values. It’s like rounding off numbers. You’ve got a range of possible values for the signal, and you divide that range into a bunch of smaller intervals. Each interval is then assigned a specific discrete value. This is important because most digital analyzing instruments can only work with discrete values. However, quantization can introduce some error, called quantization noise. But there are ways to minimize this noise, like using higher – bit quantization.
In the world of analyzing instruments, we also use statistical signal – processing methods. For example, mean, median, and standard deviation can tell us a lot about the characteristics of a signal. The mean gives us the average value of the signal over a certain period. The median is useful when there are outliers in the signal because it’s less affected by extreme values. And the standard deviation tells us how spread out the values of the signal are around the mean.
Another statistical method is correlation analysis. It measures how similar two signals are to each other. This can be used to find relationships between different variables. For example, in a chemical analyzer, you might want to see if there’s a correlation between the concentration of one chemical and the intensity of a certain signal measured by the instrument.
Now, why should you care about all these signal – processing methods when it comes to buying analyzing instruments from us? Well, the quality of signal – processing in an instrument can make a huge difference in its performance. A well – designed instrument with advanced signal – processing techniques can give you more accurate, reliable, and detailed results. Whether you’re in a research lab trying to discover new things, in a manufacturing plant ensuring product quality, or in a medical facility diagnosing patients, having the right analyzing instrument with top – notch signal – processing can make your work a whole lot easier and more successful.
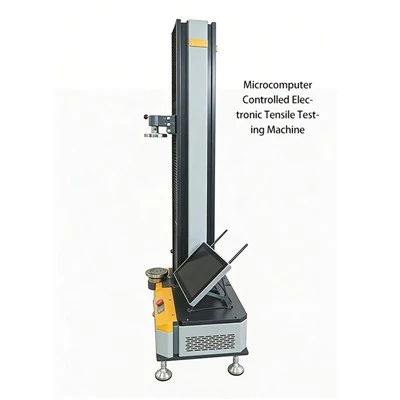
So, if you’re in the market for analyzing instruments and want to take advantage of the latest and greatest signal – processing methods, don’t hesitate to reach out to us. We’ve got a wide range of instruments that are designed with these powerful signal – processing techniques in mind. Whether you need a simple filter to clean up your signals or a full – fledged Fourier – based analyzer, we’ve got you covered. Let’s have a chat and see how we can help you with your specific needs.
Biochemical Incubation Equipment References:
- Oppenheim, A. V., & Schafer, R. W. (2010). Discrete – Time Signal Processing. Pearson.
- Proakis, J. G., & Manolakis, D. G. (2006). Digital Signal Processing: Principles, Algorithms, and Applications. Prentice Hall.
- Mallat, S. G. (1999). A Wavelet Tour of Signal Processing. Academic Press.
Hebei Wanluda Testing Instrument Equipment Co., Ltd.
As one of the most professional analyzing instruments manufacturers and suppliers in China, we have world-leading production equipment and strong manufacturing capabilities. Please rest assured to buy advanced analyzing instruments made in China here from our factory.
Address: Zhouguantun Village, Xian County, Cangzhou City, Hebei Province, P.R.China
E-mail: wldinstrument@163.com
WebSite: https://www.wldinstrument.com/
